
Objectives of the service
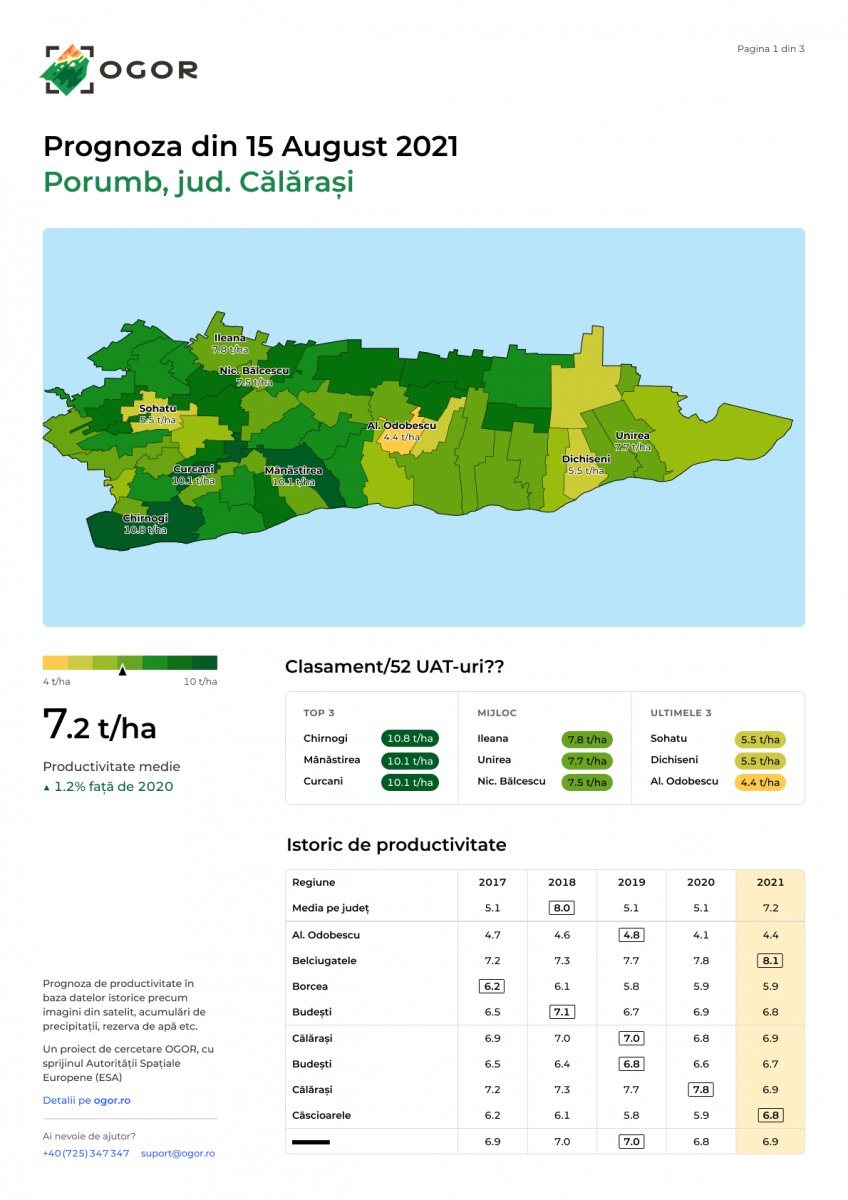
OGOR YIELD will estimate the maize productivity at different levels: field, farm, county, region, country, for all agricultural seasons, starting with 2017.
Know your yield, play your field
The majority of maize farmers don’t have yield monitors installed on their harvesters and don’t know their fields' productivity nor the productivity at the county level. Having data about previous yields will allow them to decrease costs with inputs, and to compare multiple fields where different approaches were used in order to understand what worked best.
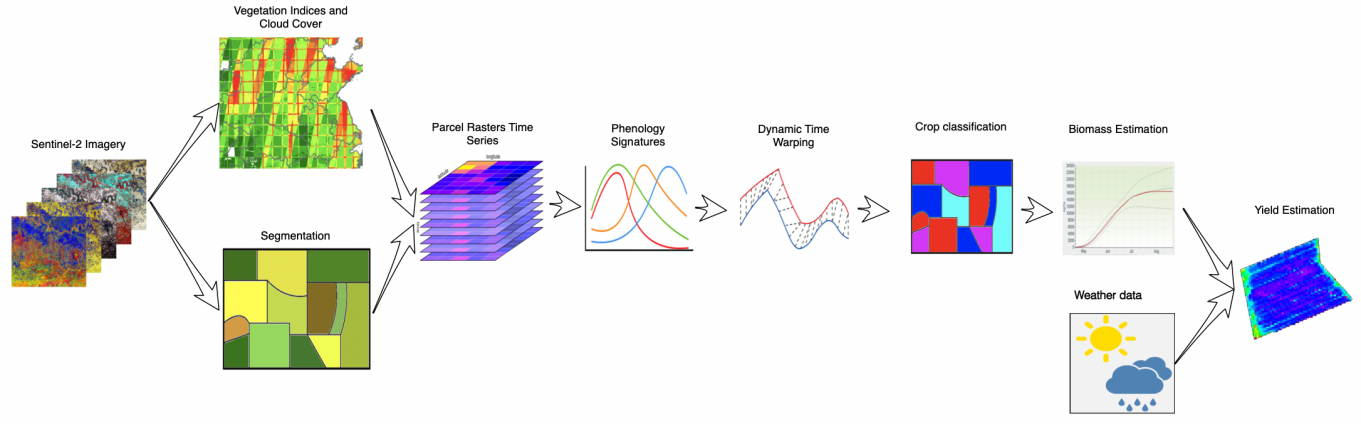
OGOR YIELD will detect the field boundaries on all of Romania’s agricultural fields, it will identify all the maize fields and estimate the biomass by analyzing all NDVI maps together with the ground truth yield data from our farmers. The yield estimation will be obtained with great accuracy after correlating the biomass, historical and forecast weather data with crop-specific water and temperature needs.
OGOR YIELD will be a service module integrated into our existing platform, called OGOR, that is a service built based on Copernicus EO Data and it already has active users, mainly from Romania, summing up more than 90.0000 ha (1% of Romania’s agricultural land).
Users and their needs
The user community that is to be involved in the project is made of agronomist engineers from the maize farms in Romania. More than 2.5 million ha are cultivated with maize in Romania, over 3.5% of the maize area in the EU, (8.7 million ha). The service requirements for this market have emerged through repeated meetings and interviews with the farmers that are customers of OGOR (and that represent 1% of the total arable land of Romania).
We have regular meetings with this group, and we have a growth rate of 20% per month in the last three months. All the new customers have induction meetings online and spend an hour with our product manager to understand their needs and requirements.
The needs identified for the moment for this market segment are:
- to compare different fields productivity and where different approaches were used (inputs, methods) to see what works best
- to be assisted in the decision if a field should be left to recover or if the crop should be maintained or changed
- to monitor the productivity evolution of the field during the current and previous seasons
Service/ system concept
The service will be provided as an extension of the existing OGOR platform, which currently serves up-to-date and historical parcel level vegetation maps and statistics to farmers across Romania. While the end product of this study will be represented by maize yield estimates, users will also benefit from some of the intermediate outputs. Both parcel boundary detection and crop classification provide important shortcuts for user on boarding, by reducing the amount of user inputs required for registration.
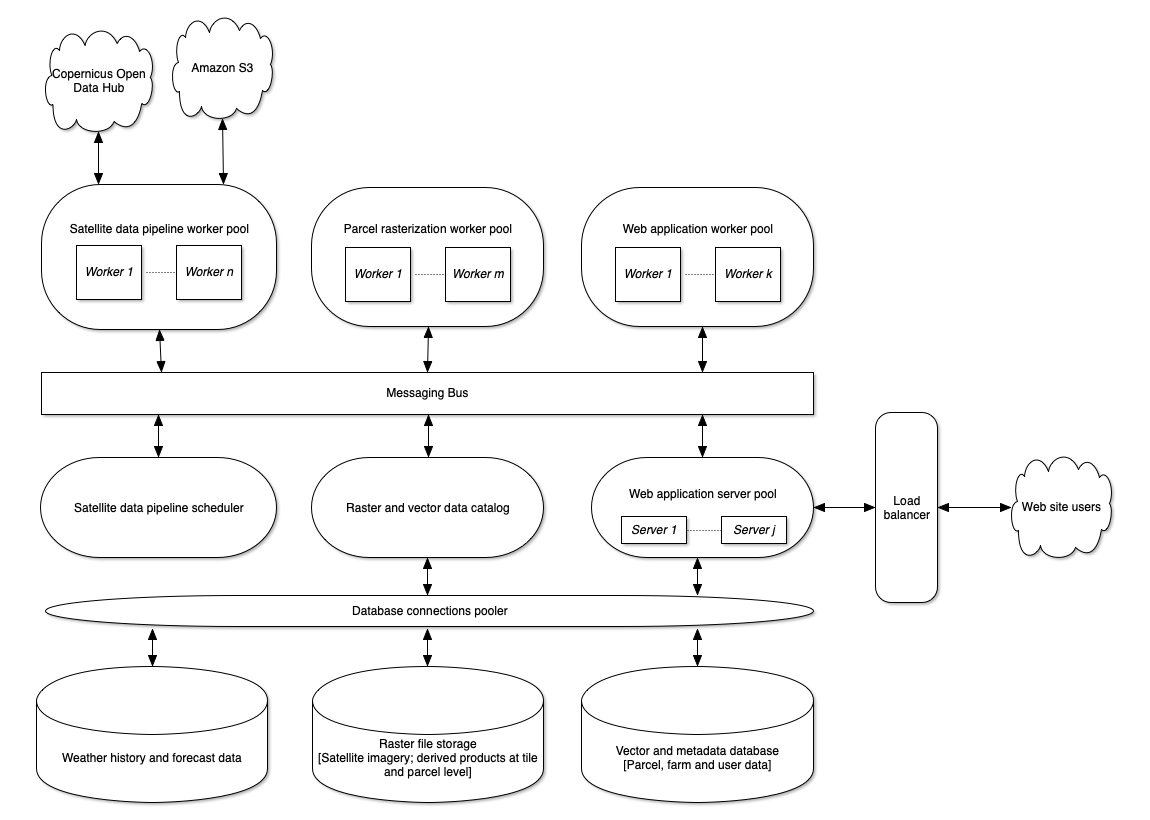
No infrastructure changes are expected, aside from scaling the number of worker nodes where appropriate, to accommodate the new workloads.
For the historical weather data we used the data from OpenWeather: https://openweathermap.org/
Image credit: Field Data Zoom SRL, Project : OGOR YIELD
Space Added Value
The space asset used by our application is Satellite Earth Observation and in particular:
- Sentinel-2 Level-1C (Top-Of-Atmosphere) and Level-2A (Bottom-Of-Atmosphere) products, which contain ortho-rectified (and in the case of L2A, atmospherically corrected) images for the spectral bands captured by the satellite's multispectral imager sensor;
- Derived georeferenced raster products for cloud detection (FMASK) and several types of vegetation indices, such as the Normalized Difference Vegetation Index (NDVI) and the Enhanced Vegetation Index (EVI).
Historically, regional and national scale agricultural productivity estimations have relied on sampled, in-situ data. To compound on the data sparsity issue, some locales (Romania included) still score poorly on the public availability and transparency of agricultural data. In this regard satellite imagery will act, as it has in other domains, as a great equalizer - by opening access to raw land data and its subsequent analysis; and, conditional on accurate classification of land attributes (such as crops), predictive analysis based on satellite imagery can over perform traditional sampling methods.
Current Status
The study was completed successfully. Ttaking into consideration that we are constantly searching for private or public funding, we intend to apply to the next ESA funding phase, the Demonstration project.