Objectives of the service

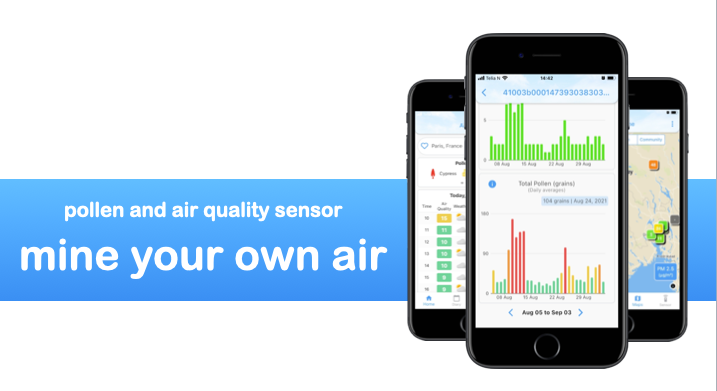
Airminer sensor - air quality and pollen monitoring where you live
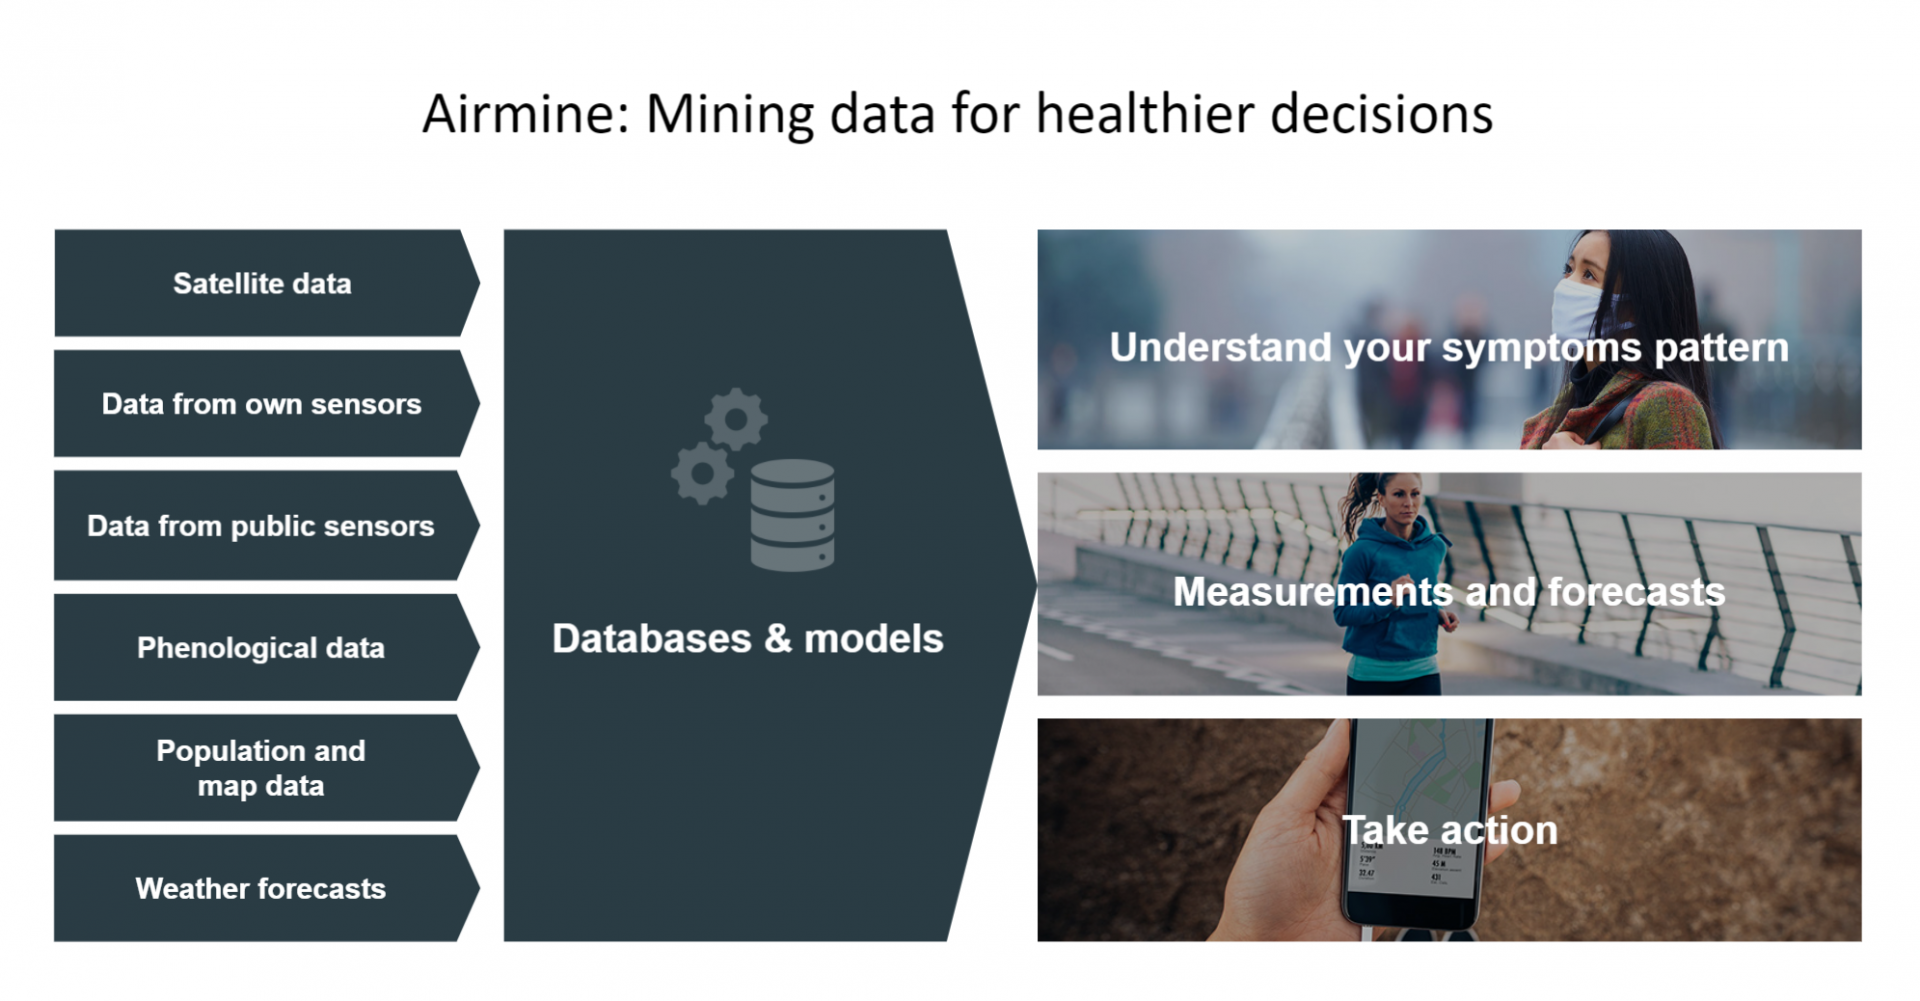
Most people spend most of their time at home. Today there are no affordable pollen sensors for private consumers available, and the public-operated pollen sensors are scarce. We offer a subscription service with a sensor and hyperlocal forecasts for pollen and air quality (pm2.5). We combine local measurements with satellite data and machine learning and our global models to give unique insight to our customers.
Global air quality forecasts
Exposure to air pollution and notably particle pollution (PM2.5) can cause serious illnesses such as heart and lung diseases and can worsen respiratory diseases like asthma and bronchitis. Air pollution remains the single major contributor to loss in life expectancy globally. We combine air pollution satellite data with other data sets like weather and population density to create hourly air quality forecasts covering the world.
Pollen forecasts
An estimated 1 of 4 people in Europe has pollen allergies. In addition, many users with respiratory issues are affected by a combination of air pollution, temperature, humidity, and pollen. To help people affected by pollen, we have developed a pollen model to quantify and forecast pollen levels. The model covers Europe and uses satellite data to determine vegetation development.
Users and their needs
Our target customers are people with non-lethal diseases triggered by air pollution and pollen. Globally there are at least 1,5 billion people affected by asthma, rhinitis, bronchitis, or pollen allergies. We are currently focusing on the Norwegian market for our sensor service.
Major user groups:
- People living in areas with poor air quality who are worried about health impacts from the air they breathe
- Need to know local air quality levels to plan their day and take precautions to limit exposure
- People who suffer from periodic asthma, sneezing or coughing and parents with children suffering from such issues
- Need precise forecasts and advice to plan their daily actions, the goal being to reduce exposure
- Need to understand what triggers their symptoms
- People allergic to one or more pollen types
- Need alerts well before pollen season starts in their location, to start medication in time
- Want forecasts to better plan their days (exposure and medication)
- Want to measure pollen levels where they live
- Technology-enthusiasts who enjoy sensors and measurements
- Like to monitor and measure their surroundings, particularly at home
- Enjoy new technology and access to their own data
- Want to use sensor data and model output to tailor their own solutions (like smart-home integrations)
Service/ system concept
App - Key capabilities to users
All users
- Air Quality (PM2.5) hourly forecast for 7 days (Global)
- 4-day pollen forecasts for Europe. Pollen maps with nowcast for Europe.
- Logging and analysis of individual symptom triggers
- Community map – see how other users react to pollen and air quality
Sensor customers
- Actuals and historical Air Quality and Pollen measurements
- Hyperlocal forecasts
- Live sensor map
Air quality and pollen sensor
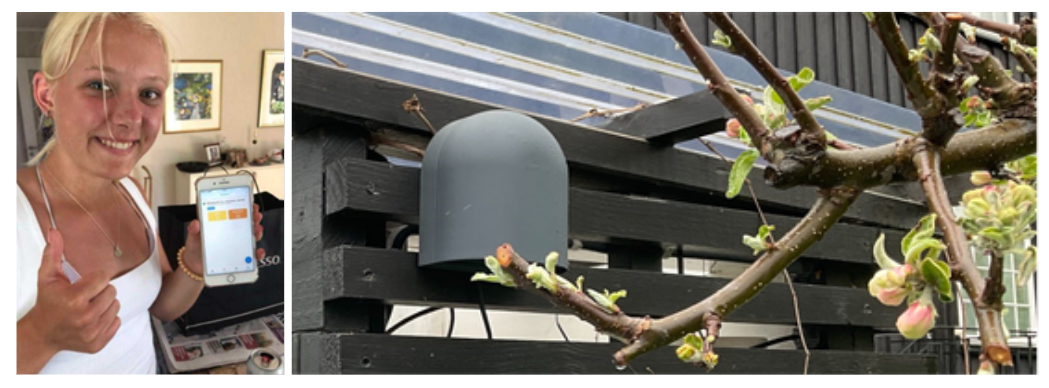
- Sensor for use in private homes, measures PM2.5 and pollen
- We are developing pollen forecasts based on sensor measurements in combination with our satellite-driven pollen models
- Available on a subscription basis, results being shown in the mobile app
- Integration to smart home solutions
API data sales
- Pollen and air quality forecasts (output from models)
Space Added Value
Global air quality model
- We use the PM2.5 estimated by the Silam model based on satellite data, which is reported through ESA's Copernicus service (CAMS).
- Meteorological data
- Used to calculate air pollution levels and calibrate our air quality forecast models
Pollen model for Europe
- Using vegetation index from Sentinel-2 to determine vegetation density. This in turn predicts the pollen release.
- Image data from Sentinel-2 for plant recognition
- Meteorological data
- Few pollen models are currently available on the market, the satellite approach gives us a potential global coverage and competitive advantage.
Pollen sensor model
- We calculate local pollen levels based on sensor measurements and plant classification based on satellite images from Sentinel-2 and machine learning
- In addition, we use the vegetation index from Sentinel-2 to determine the development of the plants
Current Status
Model development
- Model for estimating air quality globally is operational, results can be seen in our mobile app and API
- Model for pollen actuals and forecasts in Europe is operational, results can be seen in our mobile app
- Model for hyperlocal pollen measurements is available in its first version, available to our sensor pilot customers.
App and web development
- App available on Google Play and Appstore, we launch new updates regularly
- We have a web page where we post blog posts on air quality and pollen
Alexa skill – virtual assistant
- Alexa skill available at Alexa skill store (Western Europe only)
- The user can ask Alexa about air quality and pollen levels for a given location
Sensor
- The air quality and pollen sensor is in pilot testing, we have around 25 pilot customers throughout Norway and some test sensors in US, Australia and Indonesia
- The pilot users see local air quality levels and total pollen levels measured by their sensor
- We interact closely with our sensor pilot customers to get feedback and adjust our services to the users’ needs
API
- PM2.5 forecasts are available as API at RapidAPI
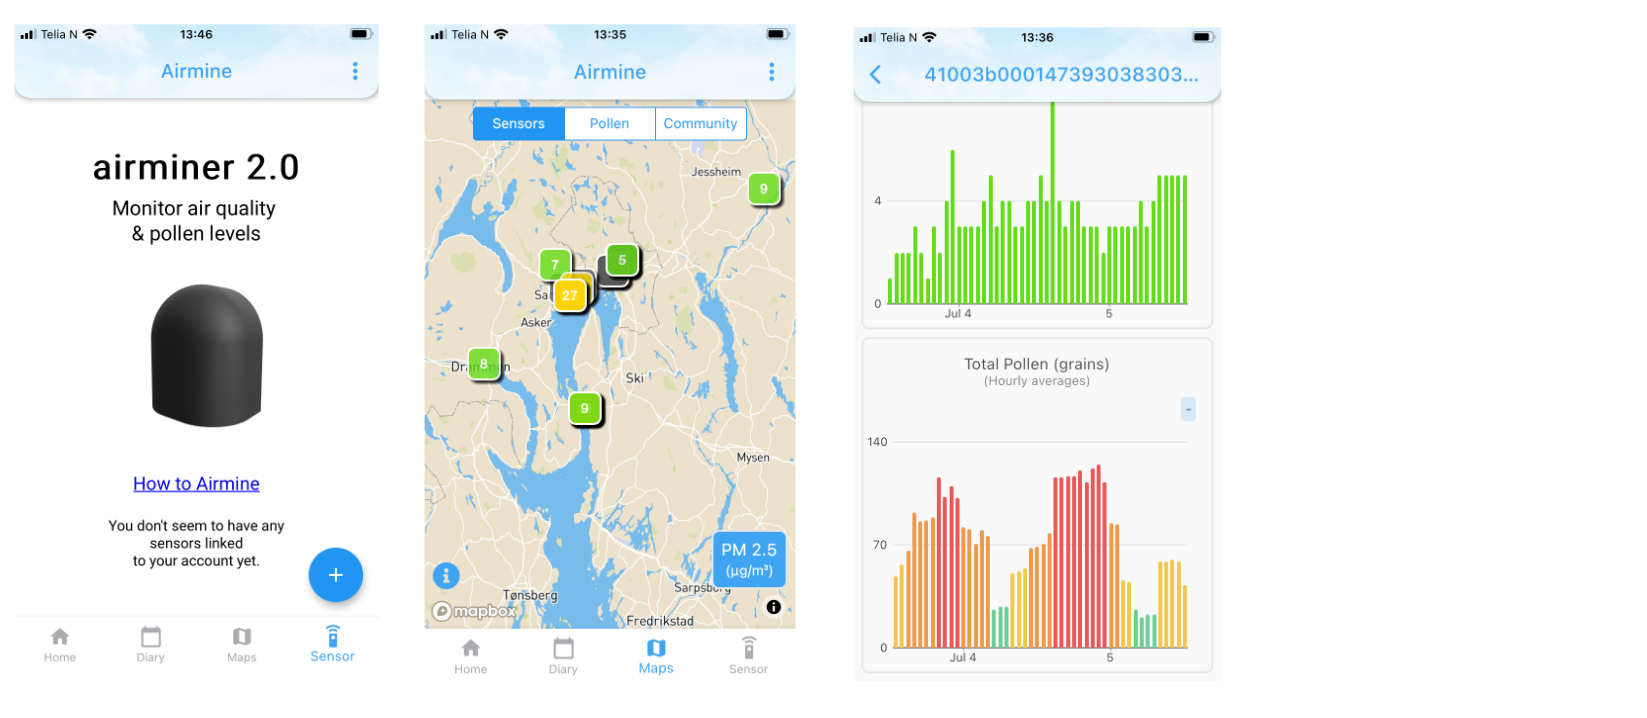
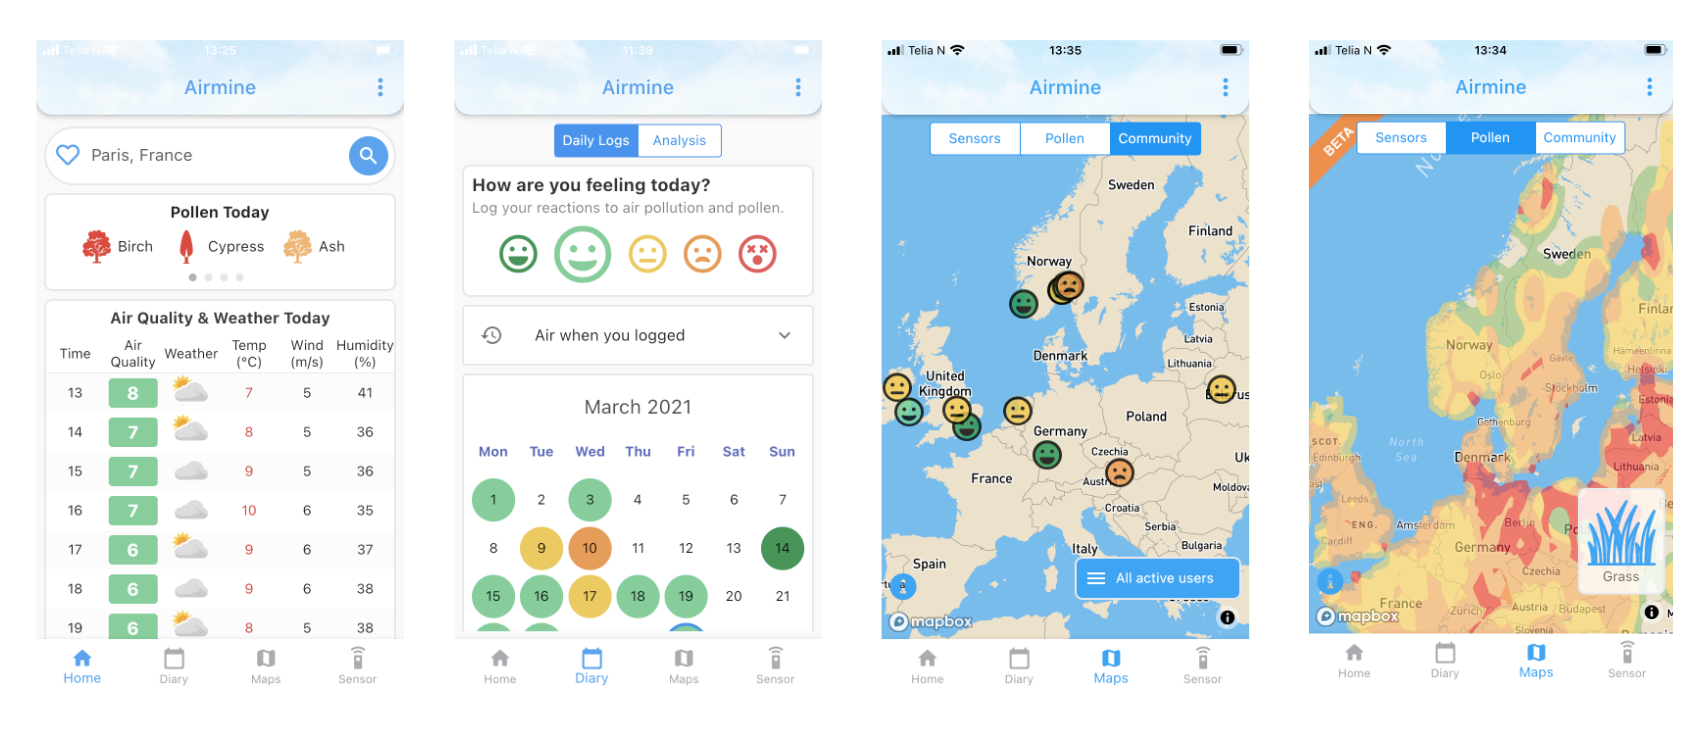
App screenshots - air quality and pollen forecasts. Symptoms logging.
App screenshots - air quality and pollen measurements from our sensors (available to sensor customers)