
Objectives of the service
Current management models do not allow portfolio managers, asset managers and city planners to right-size their holdings, negotiate with tenants, and plan city developments with sufficiency in mind. Findings from McKinsey and the Ellen MacArthur Foundation suggest that 35-40% of European office space was underutilised during working hours. Inefficient management models and space utilization suggests that the market is ready to be disrupted. CUES provides stakeholders in real estate with a surface to visualize and understand and improve asset utilization.
Users and their needs
CUES targets main stakeholders of European real estate value chain. Portfolio managers devise and implement investment strategies, construct and manage portfolios and decide on buying and selling of assets largely without building utilization insights. Asset managers manage and monitors a real estate companies’ assets, maintain contact with occupants and manage refurbishments and maintenances without building utilization insights.
Service/ system concept
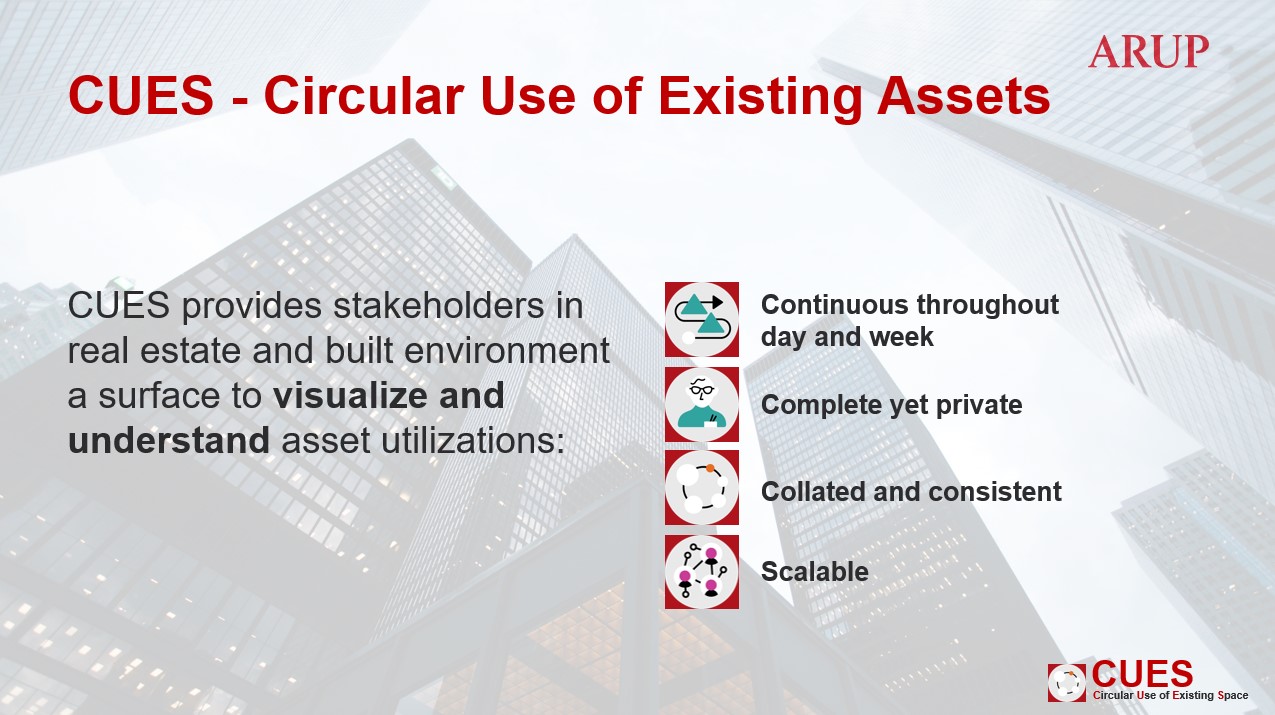
CUES provides stakeholders in real estate with accurate information of an asset’s utilization over time. Utilization is expressed in a binary format (presence / non presence) and independent of the nature of a person’s activity (waiting, working, visiting a space).
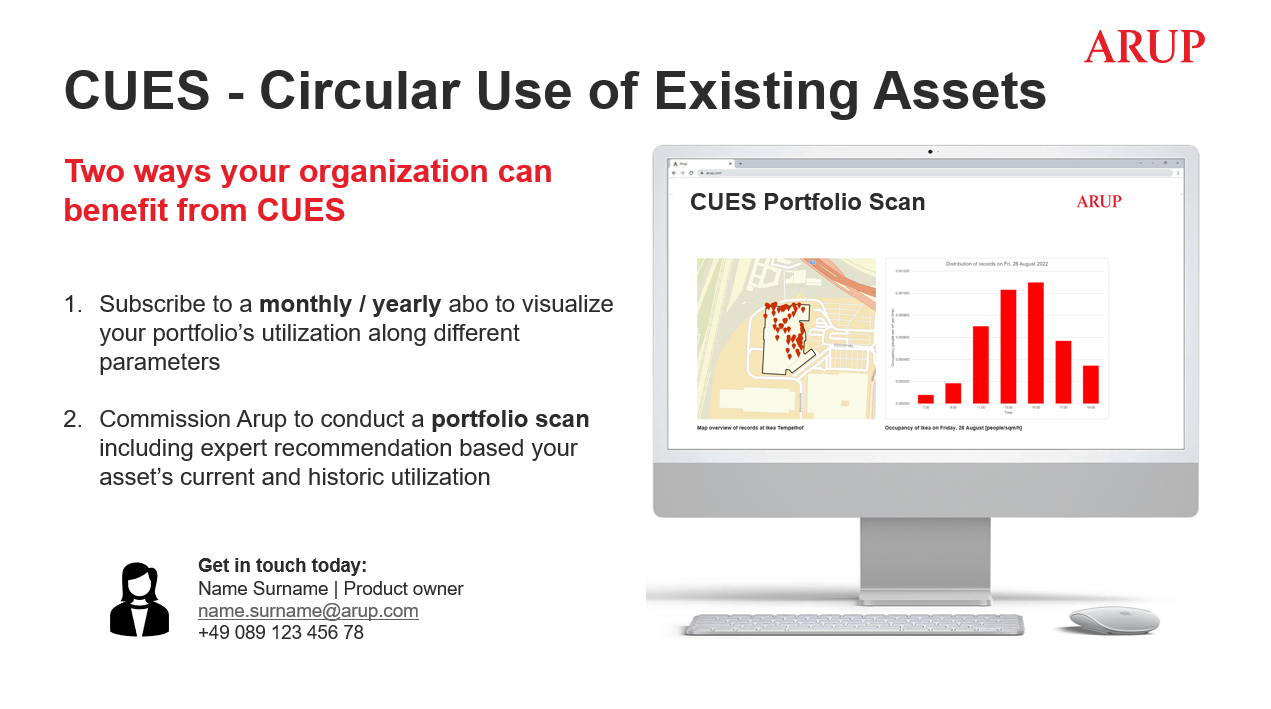
Users of CUES can select assets within their portfolio and access information on how many peoples have been in the building at a specific point in time or over a period of time as the information requirements of the user require.
CUES accesses voluntarily shared handset location data and plots them in a function of time to allow insights in where and how long are present in specific parts of a building.
Space Added Value
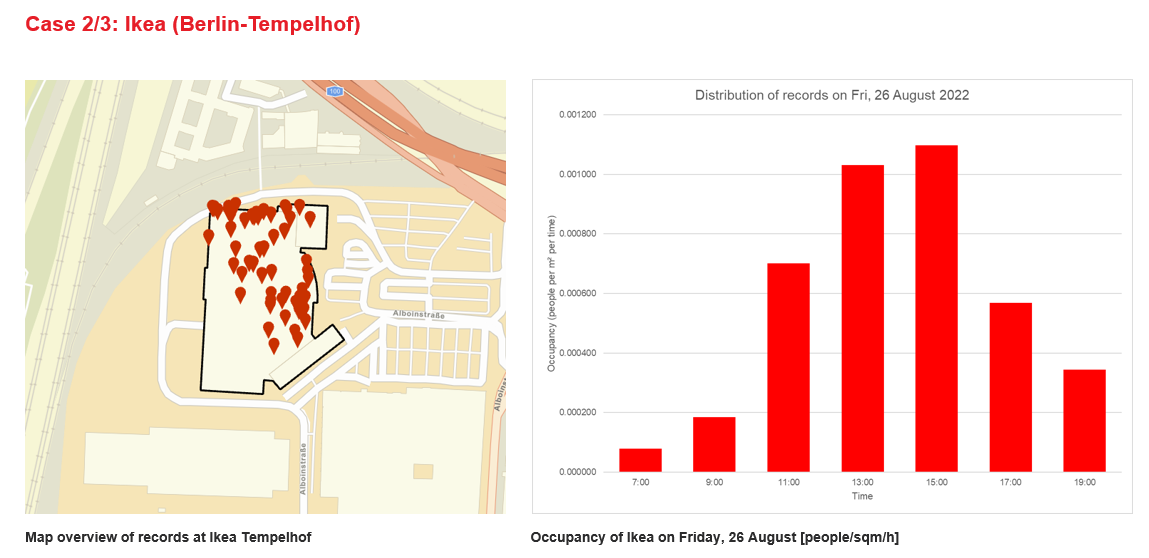
The space assets used are openly accessible satellite data that were used to display the location data of the users. These are static satellite images that represent the map background of the analysis. The added value is the mapping of occupancy points and mapping over time.
Furthermore, telephone data was used in the analysis to show the actual usage. This analysis and representation over time shows the utilisation of a location and can provide conclusions about the (re-)usability of the respective location. The special added value in our service lies in the processing of actual user data, over time as well as location. This means that no fictitious calculation models are used, but actual results are generated as they occur in reality. Additional information can be derived from the resulting trends.
Outlook: With the help of trained data sets and machine learning algorithms, a precise forecast of the use and utilisation of locations can be made. With the incorporation of real-time satellite images, environmental factors (weather) or mobility factors (e.g. traffic jams) can also be simulated.
Current Status
Arup have concluded, that the RE industry – through generally interested in novel data points around space utilization, currently has no usage for the proposed service. Prime reason for this is the split incentive between landlords and tenants, which makes inefficient space utilization of let spaces desirable for landlords.
To test the technical potential of the proposed solution, a MVP has been developed which helped delivering a proof of concepts. Granularity of data input however isn’t sufficient to plot a realistic picture of an asset’s utilization, when compared to ground truth data of building utilization.
Prime Contractor(s)