Objectives of the service
SATELLITE IMAGERY TO VISUALIZE STAKEHOLDER and CLIMATE RISK.
The objective of the ARCTTM de-risking tool is to help project owner and decision makers move forward with projects and spatial planning processes.
Imagine a construction project, for example building of a road or building. The weather gets warmer, wilder and wetter and investors, decision makers and local stakeholders need to pay more attention to climate change and understanding of extreme events to de-risk and secure the value of their portfolios against physical impacts on their surrounding environment, infrastructure and society as a whole.
Project planners, policy and decision makers increasingly need to visualize Stakeholder risk and Climate consequences.
The main benefit and added value for ARCT of using Sentinel 2 imagery is that you know exactly when the image was taken which is not the case with Google Maps currently used by ARCTTM. Historically airborne data is limited and much more expensive (airplane/drone). Satellite imagery benefit customers who needs dated, quality images back in time, for example to identify Climate factors that first are understood, or first showing its effect after a period of time. www.arct.tools.
Users and their needs
Today project owners and decision makers face huge risks due to:
- Lack of stakeholder satisfaction and transparency.
- Increased risk of conflicts, costly delays and stopping of projects.
- Work processes that are cost-driving, outdated and ready for a change.
How will a project affect its surroundings? What is the right project location?
How must a project adjust its design to its surroundings?
Decision makers and investors need to pay more attention to understanding stakeholder risk and the potential Climate consequences to be able to move forward with projects and spatial planning processes.
They also need to include the risk of extreme events and climate to be able to secure the value of their portfolios against physical impacts of climate change.
In addition, society increasingly demands that business implements the UN Sustainable Development Goals (SDG) in their daily operations.
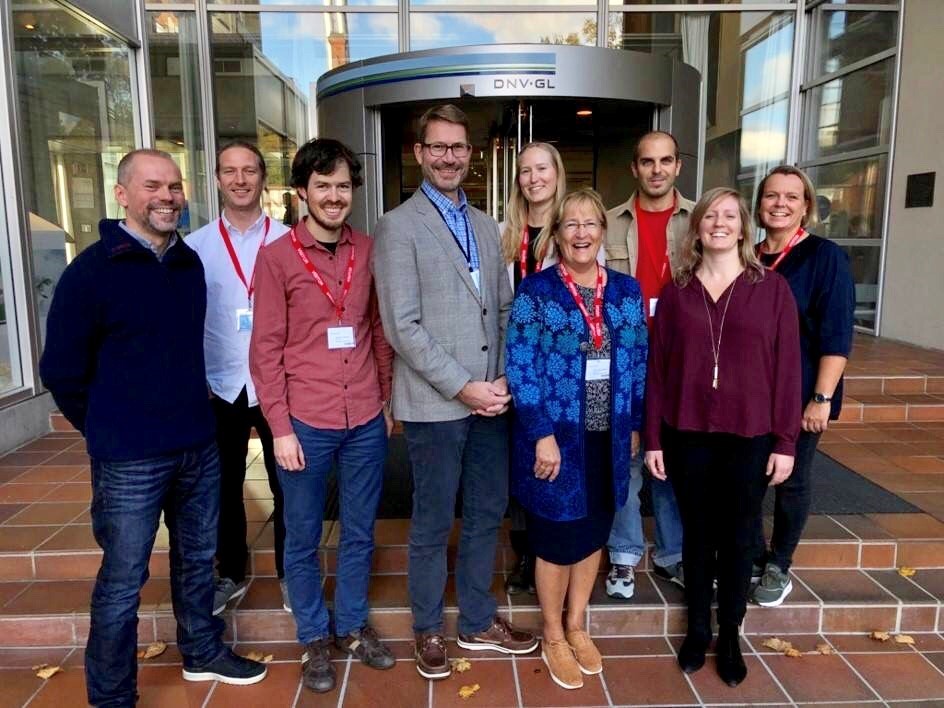
Photo Eli Berge / Fotofil.no.
Team Picture at the ARCT project kick-off Work shop at DNV GL’s offices.
Frank Hanssen, NINA. Hans Petter Harveg, Megapop. Borgar Aamaas, CICERO. Hans Petter Dahlslett, DNV GL, Annelise B. Kullmann, Karin Berentsen, ARCT. Daniele Fantin and Christina Aas, S&T. Lill Bente Hollstedt. Cathrine Henaug, NINA.

The first target is Norway, the northern areas, the Arctic and then the global market.
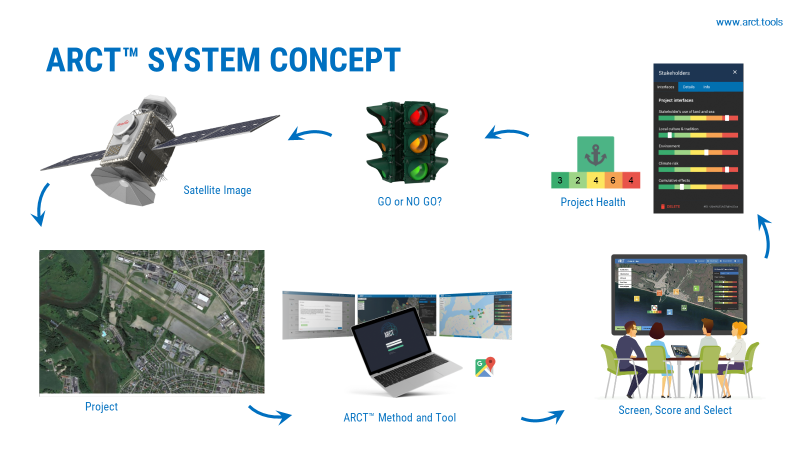
Service/ system concept
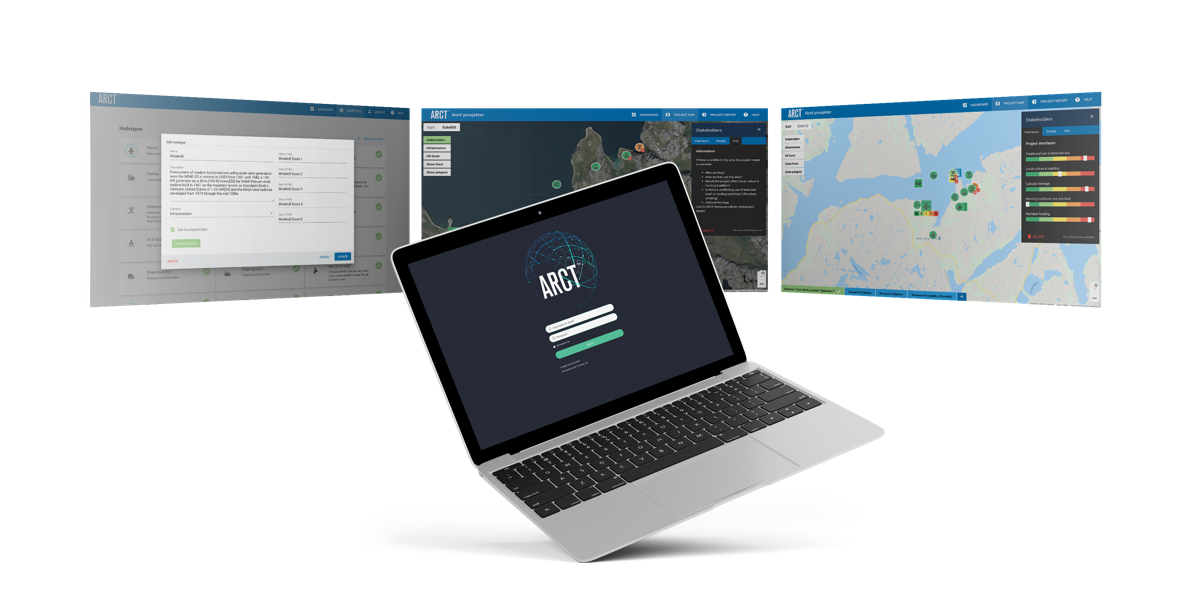
ARCTTM Stakeholder mapping tool visualizes “Project Health” with menus where the user may screen, score and select relevant stakeholder elements that may impact a project’s location and design.
A new ARCTTM ‘Sentinel Satellite’ module would import and use dated satellite imagery instead of using the current Google maps. Several case studies related to harbour and spatial planning processes were evaluated in Greenland, Nome, Alaska/USA, and northern Norway.
Sentinel 2 satellite imagery was downloaded and sample images studied to evaluate added value of using satellite imagery to be able to secure value, understand stakeholder risk and potential Climate consequences.
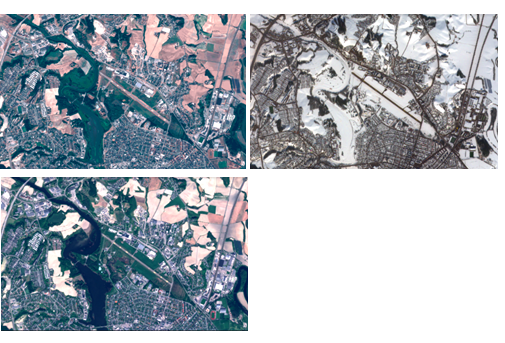
These Satellite images of Nitelva animates normal flow, winter, and flooding caused by the extreme rain, May 18, 2018 (just after the Sentinel II came operational). It visualizes the climate effect on a relatively small catchment area which makes the river sensitive to short-term and intense rain events which causes risk of overflowing / flooding.
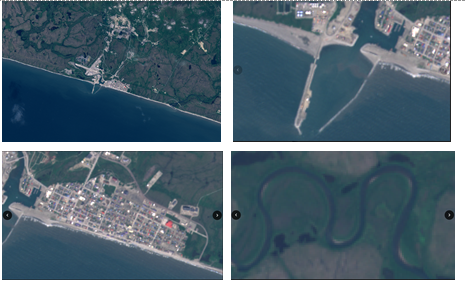
The Sentinel 2 images over Nome demonstrate resolution of the ‘for-free’ images. The next images present the commercially available images of higher resolution (Stockholm area).
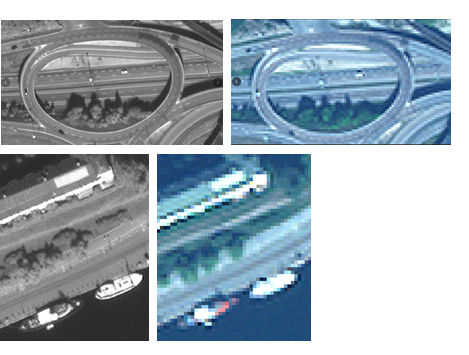
Figure 2: Worldview-2 sample/ Stockholm: resolution of 0.31m(panchromatic) and 1.24m(RGB).
Space Added Value
The advantage of using Sentinel 2 imagery is that you know exactly when the image was taken. Sentinel 2 revisits any place on earth within 5 days, the archived imagery is free/open data allowing anyone to access imagery from recently, from several months or years ago. With Google Maps you simply have to accept the one and only image available over your region.
Historic airborne data is limited (especially in arctic) and much more expensive (airplane, helicopter or drone). The added value is significant when it is required to go back in when it is essential to be able to search in dated, quality information for a given period of time.
Current Status
The ARCT kick start project launched September 2018 and was successfully completed in March 2019.
The ARCT tool uses Satellite imagery to visualize and give a user an overview and understanding of stakeholder risk factors and potential Climate consequences that is needed to de-risk and secure the value of project owners’ and investors’ portfolios.
Decision makers increasingly need to pay more attention to understanding stakeholder risk, social considerations and the risk of extreme events and climate to be able to de-risk and avoid costly changes in the construction and operation phase.
ARCT combines these risk factors and makes them relevant, simple and visual.
It was found that the MAIN BENEFITS for Arct of using Sentinel 2 imagery rather than google maps imagery is the timeliness and quality of the images.