Objectives of the service
In this demonstration project we developed a service solution, providing location-based information on the current and future distribution of the population by age groups and education level. For the most granular product also other socio-economic parameters are available.
It has been shown that information derived from EO data significantly improves existing census data through a modelling approach based on land cover and land use information. Thereby, AgeSpot links EO derived population density with state-of-the art demographic models. The unique approach not only provides spatially explicit demographic data along with information on education and others, but also allows long-term forecasting at different levels of granularity.
AgeSpot creates a new market and value network by offering a “one-stop-shop” for spatially explicit population and demographic data available. Customers do not need to arduously assemble and analyse different sources of external data but AgeSpot enables them to access standardized key information with already integrated external data information and improve the existing data situation in many innovative ways.
Users and their needs
AgeSpot offers a unique service proposition by providing a technical solution covering all sectors basing their business model on timely and highly precise population age structure information, with stakeholders from different sectors to help them find out where to offer which specific services and to adapt their supply to the local demand depending on the demographic structures of different regions. For the public sector, AgeSpot data makes it much easier for governments to better meet the needs of regional and district populations.
Furthermore, it is an important signpost for taking the right steps to promote local economies. Additionally, AgeSpot provides the basis for the prediction of future population growth developments and is expected to enter further markets and meet the information needs of private and public sectors on a global scale. AgeSpot will assist organizations – both private and public – interested in investigating where to offer certain services and how to adapt their supply chain to the local demands depending on the demographic structures of the different regions. Further, the modelling and forecasting of additional socio-economic parameters, such as education and health are provided to support various analysis.
User’s needs provided by AgeSpot:
- Supporting decisions based on granular population data: AgeSpot provides exact information on where how many people belong to each target group at different levels of granularity.
- Customized service: AgeSpot offers a unique service in which the choice of products for every location is geared to the needs of the customers.
- Data driven decision making: AgeSpot allows to make cost-effective decisions on where to expand and from which markets to withdraw based on high-quality (future) projections of spatially explicit population information.
- Reliable projections of future demands: the AgeSpot service allows for investment decisions to be based on granular population data and realistic projections of future demand.
- Easy access to accurate and up-to-date spatial data on potential customers
- Expectations have shifted from “backward looking” to “real-time” with an “forecast” capacity
- New technologies enable fine-grained decision-making on global scale with forecast capability
- Many sectors require credible, location-specific information and forecasts about populations dynamics at local to global scale
- Privacy considerations must be observed and ensured
An overview of the AgeSpot products and feature options are shown in Figure 1:
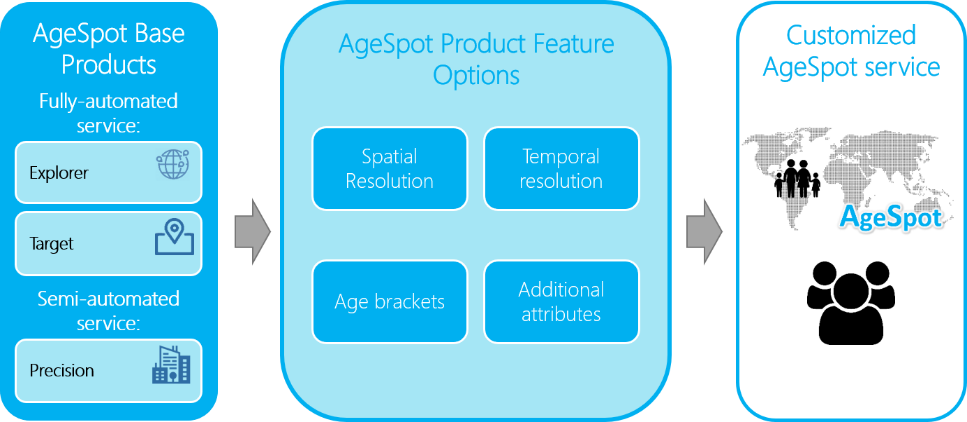
Figure 1: AgeSpot product range
Potential users belong to nearly all economic sectors operating world-wide on regional to global scales. During the project, a prominent group of champion users were able to test and use the developed datasets.
Service/ system concept
AgeSpot is tailored to the global demand for business intelligence data, a driving force for economic growth. It enables customers to easily access granular, standardized, and up-to-date key information about their target groups providing a new information service for spatially locating and forecasting population demographics.
This information is derived through a system that implements the following key innovative technical components (Figure 2):
- Satellite Observation Module: EO (Sentinel-2/Landsat) derived information enables a service that significantly improves existing census data through a modelling approach based on land use information. Further, this model provides statistical information about the distribution of the population in their residences. With the help of additional spatial data such as land use and degree of sealing of the surfaces, as well as statistical population data over a larger region, a precise, high resolution disaggregation of the population takes place.
- Enrichment Module with a demographic and a statistical forecasting module: In a Bayesian Model Averaging (BMA) approach a large number of spatial and demographic variables are identified to determine the population number per age cohort on up to a 25 m grid level.
- Regressions are set up using the change in the share of the age group from one point in time to the next as dependent variable in the equation. The forecasts are refined using an urban growth model. This method is applied to forecast the trends in urbanization and project, which parts of a city or country will emerge to urban built-up areas in the turn of the next years.
- Provision interface: Data provisioning interface used by both companies linking the production system with the AgeSpot Customer Access.
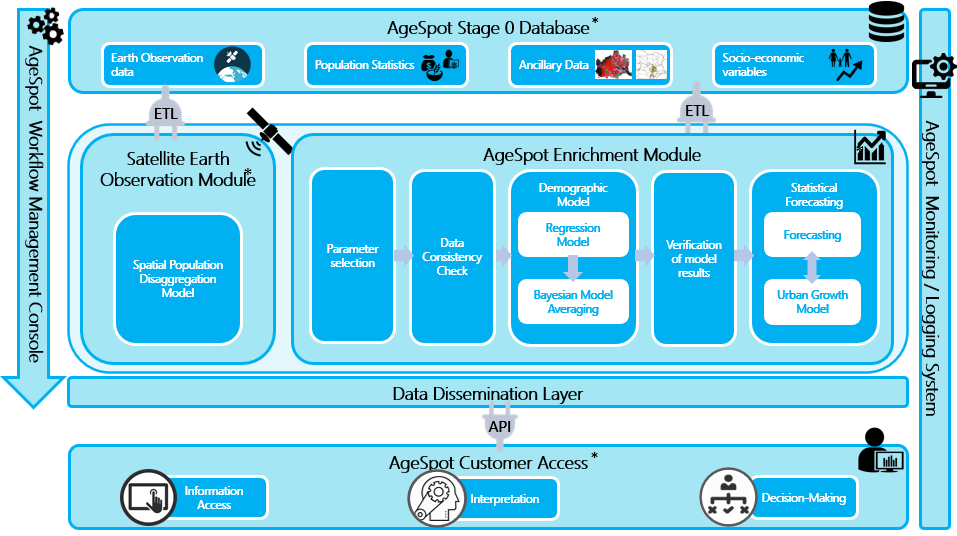
Figure 2: High level illustration of the AgeSpot system architecture
Space Added Value
The baseline for this project is the Satellite Earth Observation (EO) component. The EO derived information significantly improves existing census data through a modelling approach based on land cover and land use information derived from EO satellite data (e.g. Sentinel). A basis for determining the spatial population distribution is formed by the generation of imperviousness densities. Satellite EO data can extract such land use information to a sufficient degree of accuracy to supply the reliable base information necessary for this service. The linking of the data with the statistical information on demography is sufficiently accurate thanks to the spatial population model developed by GeoVille and its continued improvement since first application. This EO modelling tool ingests high resolution EO data providing the basis for products on different granular levels (25m to 100m spatial resolution).
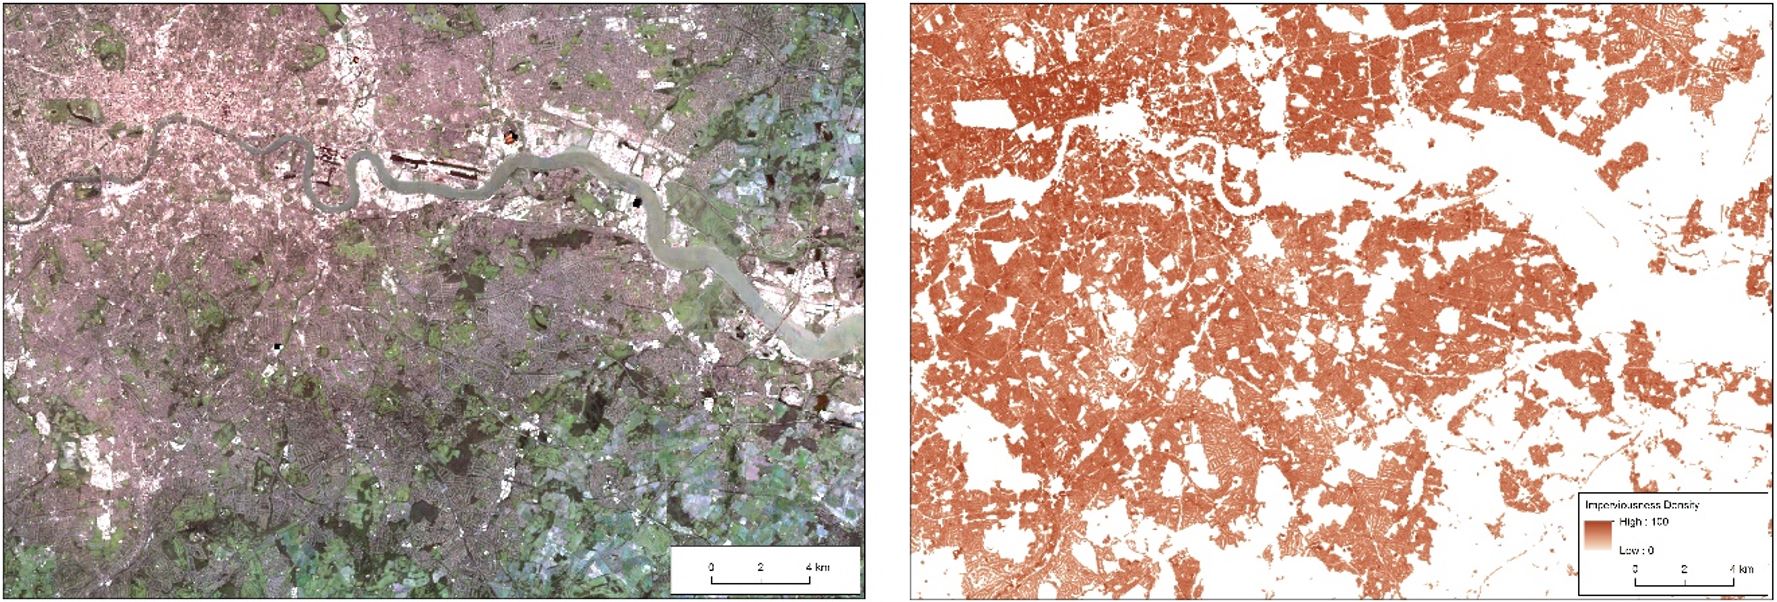
Figure 3: EO data (LS 8 2015; left) and Imperviousness densities (right) derived therefrom for part of the Greater London Area, UK.
Current Status
The Demonstration Project kicked off in February 2019. The initial phase of the project has been focusing on the engagement with various champion users from the telecommunication and spatial urban planning sector with the goal of determining their needs and specific user requirements. Resulting from these, the system requirements on AgeSpot have been defined and form the basis for designing and setting up the system and service architecture. In parallel to the user engagement activities, Earth Observation and census data have been acquired and technological developments have taken place. These comprise improvements on the population, demographic and forecasting models, including the new urban growth model component (Figure 4), showing future urban expansion. Later in the project, the focus was on operationalisation and global market readiness with more champion users from different sectors.
The project ended in March 2021 reaching Service readiness level 8 out of 9. The service is completed and validated and the commercial offer is ready.
Major achievements during the project were:
- Development and in-depth tests of the whole product portfolio in several sectors according to the user requirements of a prominent group of champion customers, but also other stakeholders have been approached.
- Process of integrating Bloomberg as a certified re-seller of DemographEye through Bloomberg’s Alternative Data Store.
- Successful demonstration of the operational readiness of the AgeSpot system during the FAT and SAT meetings.
- Establishment of the database containing over 15.000 relevant datasets on a global scale.
- Additional socio-economic parameters (health and education) were modelled in addition to age.
- Improvements of the existing models and the development of further model components such as the urban growth model and the expansion of forecasting capacities to the year 2030.
- Establishment of the go to market strategy and a Business and Licensing Model.
The market analysis demonstrated that the demand for business analytics worldwide is expected to burgeon over the coming years. Hence, we expect that over the next 20 years geospatial demography service will emerge as a core area of predictive analytics business landscape and will ultimately serve as an “industry standard” to inform decision-making and investment selection across the global economy. AgeSpot will, therefore, be well positioned as an in early industry leader and trusted brand.
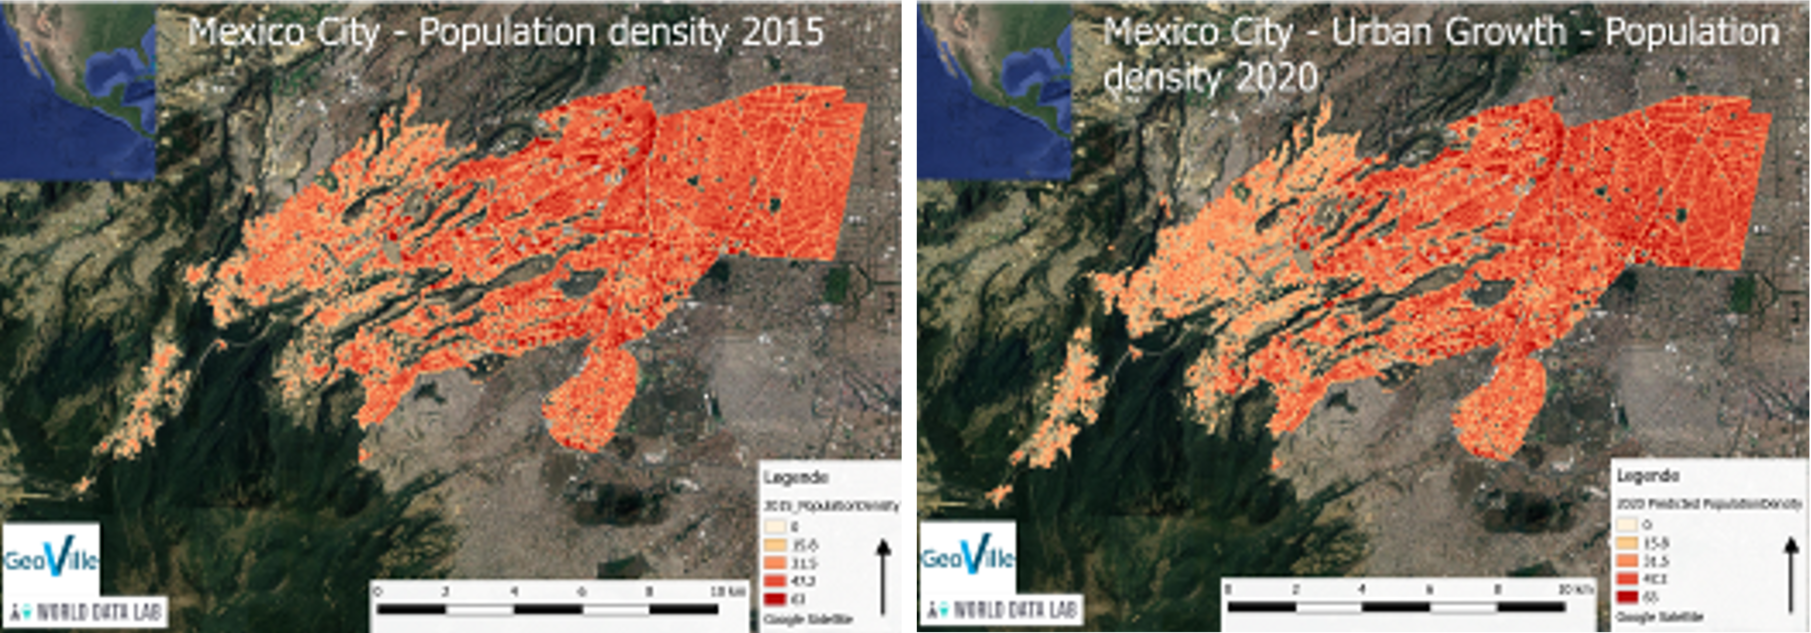
Figure 4: Comparison of the Population Density 2015 and the predicted Population Density 2020 based on the developed Urban Growth Model in Mexico City in 50 x 50m resolution.
Modelling activities have begun on the Greater London Area, which constitutes the first AOI for demonstration purposes in the project (Figure 5).
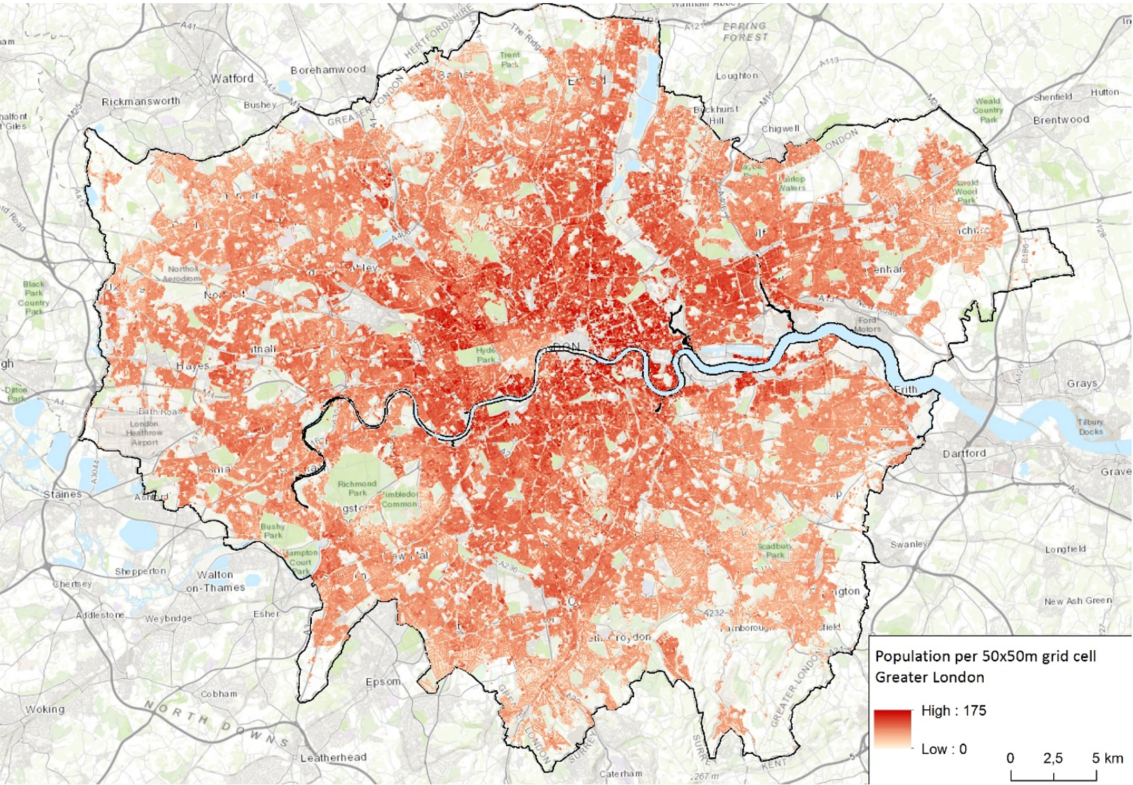
Figure 5: Spatial distribution of the population in the Greater London area for 2015 (Precision Product: 50m resolution).
In Phase 1 the focus laid on the development of the bespoken service, the high-quality precision product. Based on this experiences, Phase 2 reaches out for the provision of a second parameter, such as education level or health parameters (Figure 7) and the global roll-out and implementing a fully- automated service for the explorer and target products shown in Figure 6.
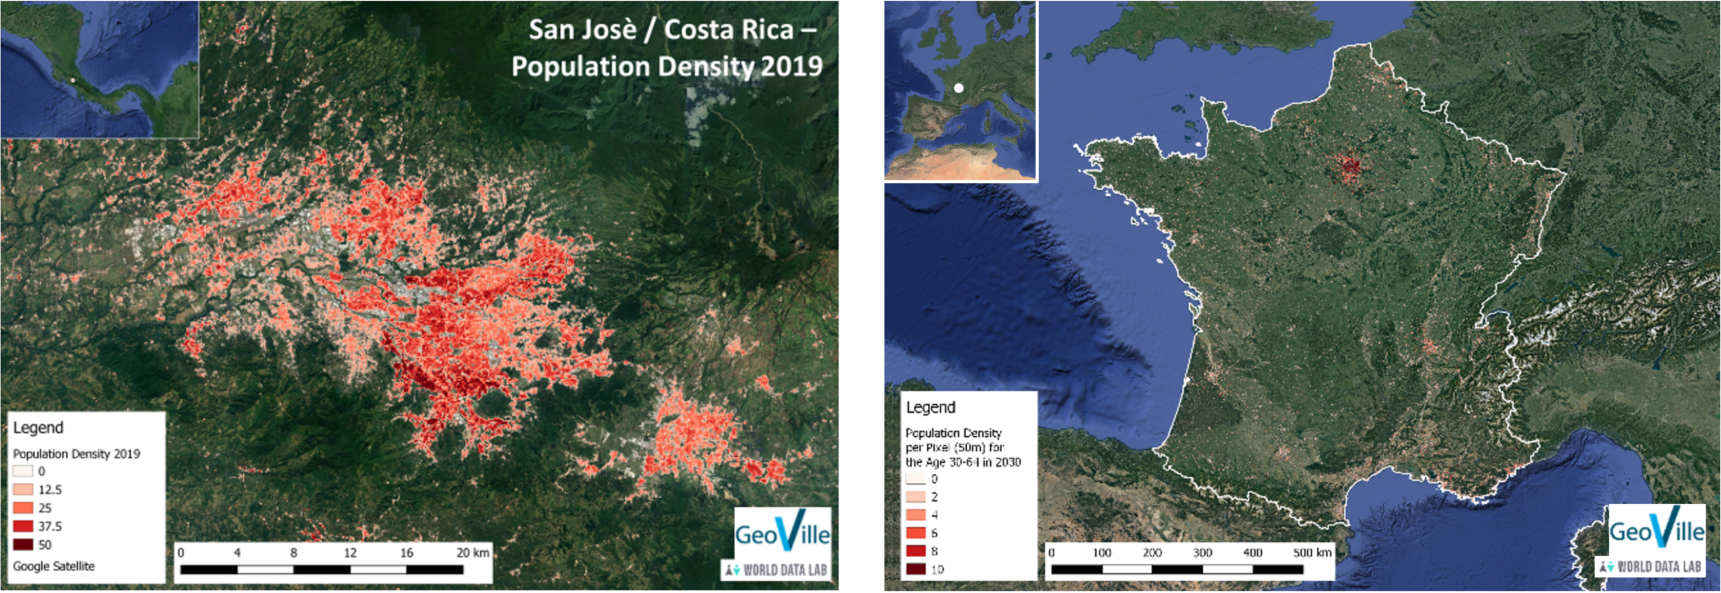
Figure 6 showing the result of the explorer product in Costa Rica in 100x 100m resolution (left) and the target product in France in 50 x 50m resolution (right).
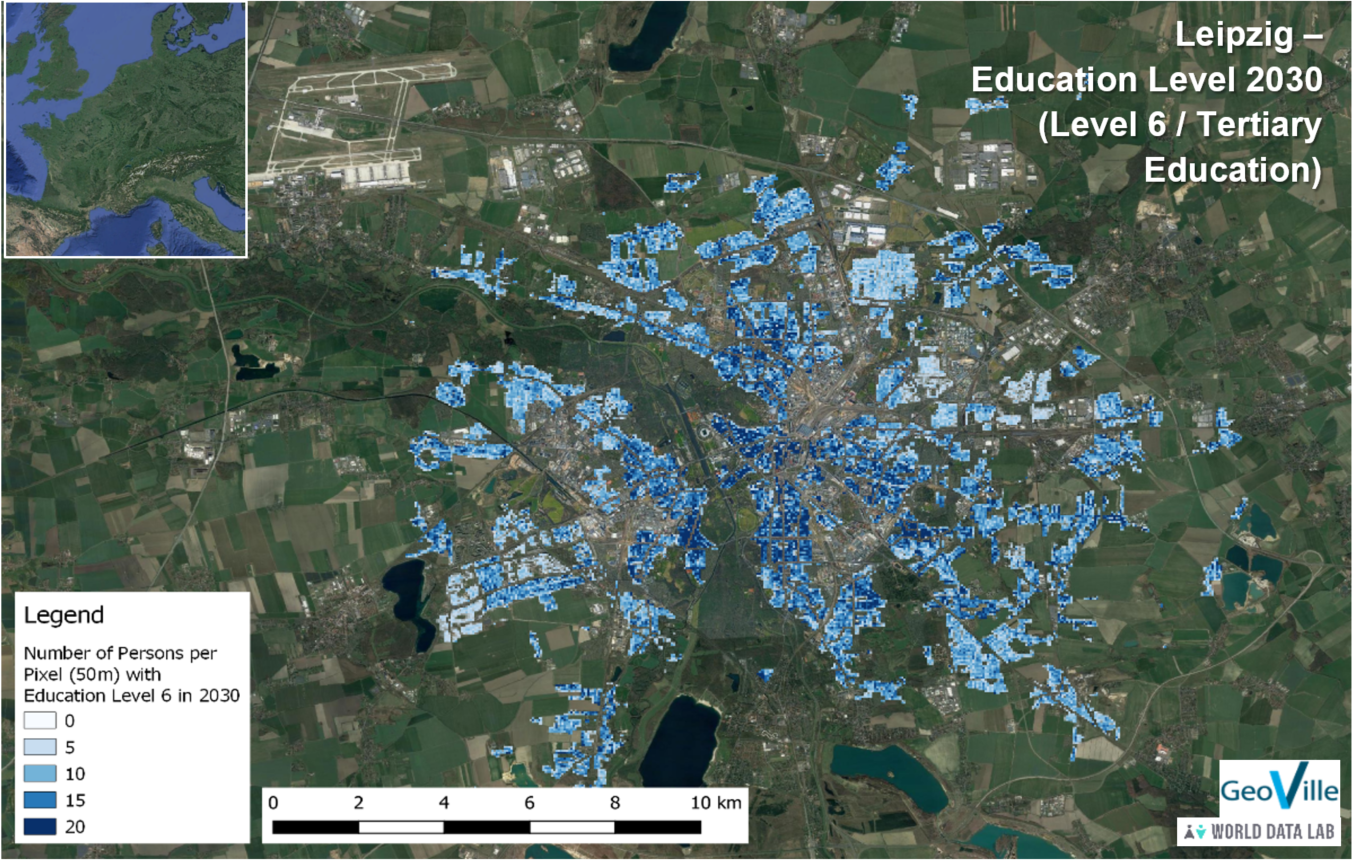
Figure 7 showing the result of the target product for the second parameter – education level (Level 6) in Leipzig in 50 x 50m resolution
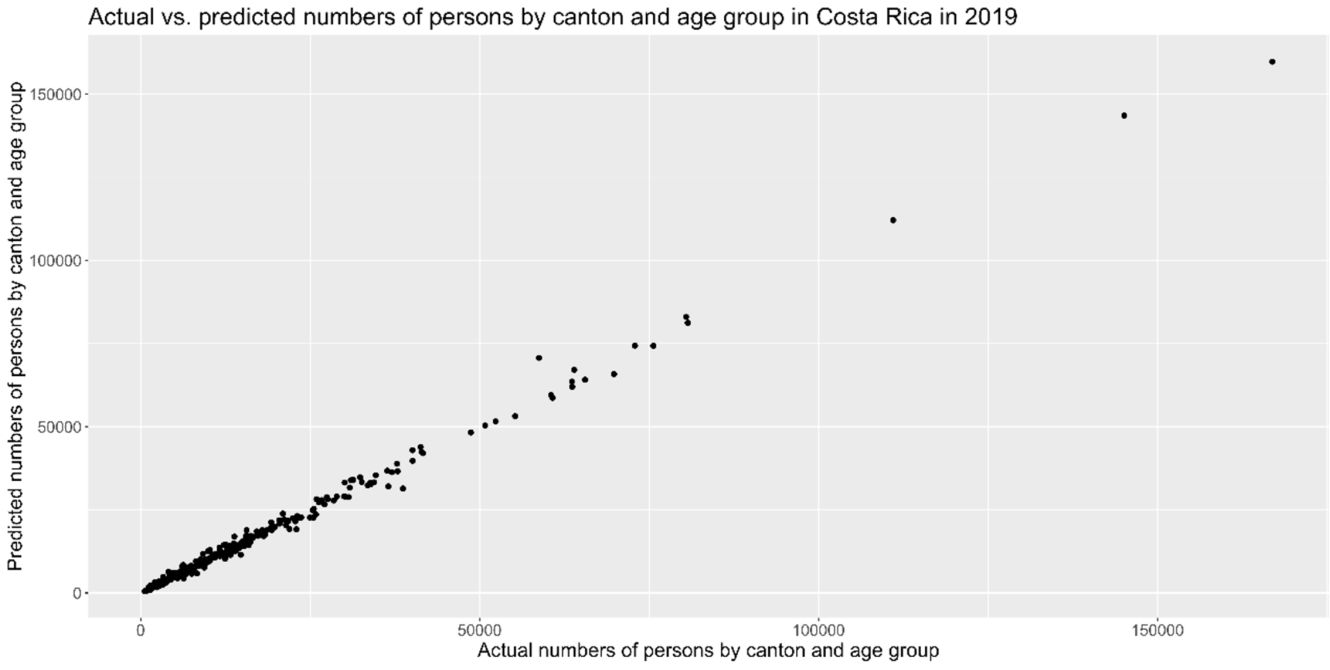
Figure 8: Validation results of Costa Rica use-case. actual vs. predicted numbers.
To enhance the quality of our validation results of the demographic model we have compared our results against data from an independent source that has not been used as an input to our model. As use case the London AOI has been chosen as independent granular data was available. Potential independent sources for data could be studies from universities or other research entities as well as data from companies or organizations that collect information without relying on official numbers. For our AOI of Greater London and in particular for the borough of Greenwich we have used ward-level data from CACI Acorn, an independent consumer classification that is deemed statistically robust by the UK Office of National Statistics. These data are provided on the borough’s official website and are publicly available. For the validation we have compared the ward-level shares of four different age groups (0-17, 18-34, 35-64, and 65 plus) from our results for 2020 to the ward-level shares of the same age groups in the data from CACI Acorn. Based on this comparison we have found a root-mean-square error (RMSE) of 0.032 and a mean absolute error (MAE) of 0.025 in the shares of all age groups. To visualize this comparison, we have also plotted the shares from CACI Acorn against the shares in our results. Figure 9 shows the results of this part of the validation exercise.
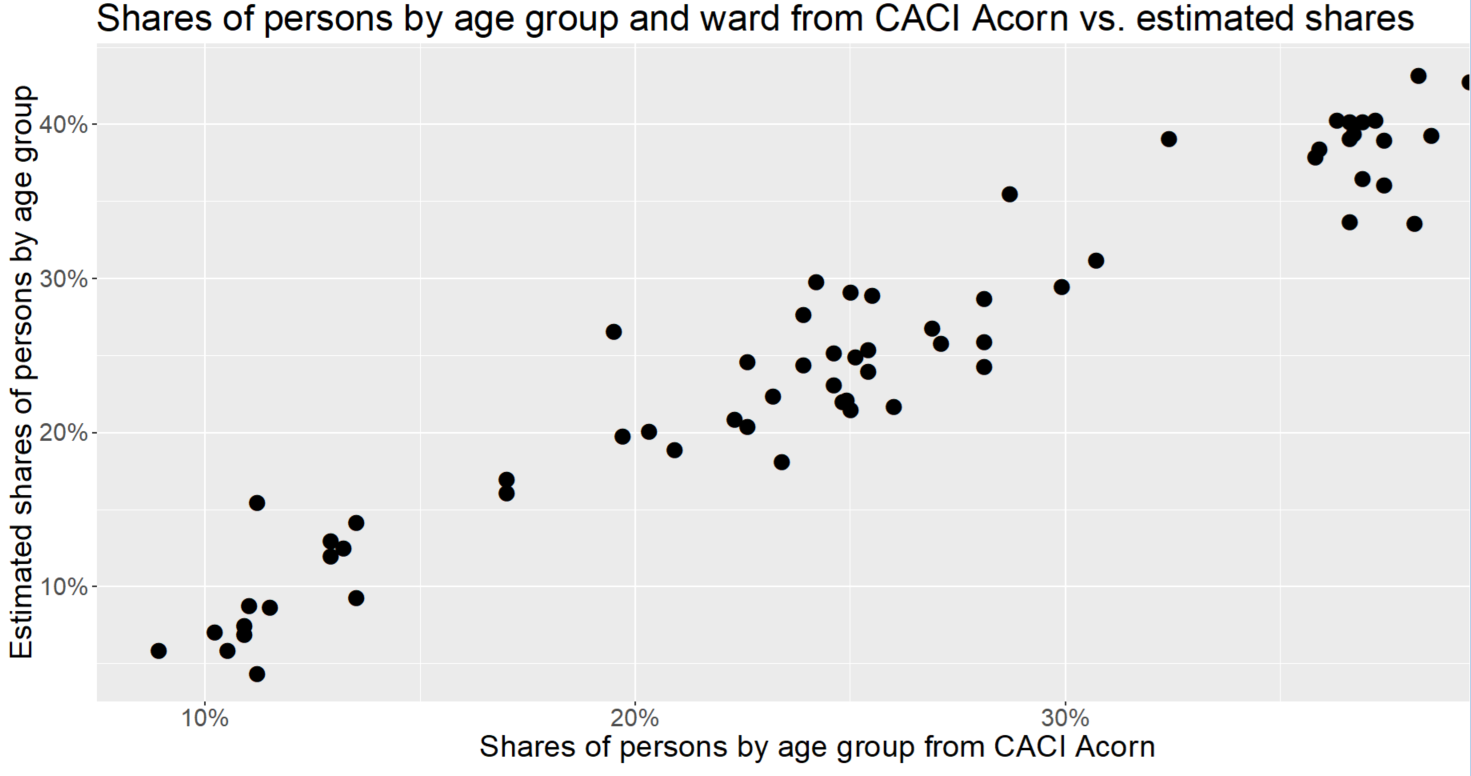
Figure 9: Shares of persons by age group in Greenwich – CACI Acorn vs. AgeSpot estimates.