

Objectives of the service
The last decade has seen a steady increase in disaster and natural catastrophe economic and insured losses. Although it is not yet possible to produce causal proof, there is strong evidence that the surge of natural loss events worldwide is correlated with climate change.
(Re)insurance companies are directly exposed to climate change challenges, while uninsured assets are increasingly exposed to climate change risk.
Our service strives to offer spaceborne licensable data products to be used by (re)insurance companies to help tackle climate change challenges and to close the uninsured vs insured assets gap.
Users and their needs
(Re)insurance companies are faced with the following challenges:
- Natural catastrophes and severe weather events generated a stunning USD 138 billion of insurance and reinsurance market losses during 2017, up 190% on the prior year and way above the USD 50 billion ten-year average.
- Just in 2017 USD 337 billion economic losses were uninsured, while the insurance and reinsurance industry took a significant share at USD 144 billion, the highest annual industry loss ever recorded.
- More than 76% of disaster and natural catastrophe losses are uninsured, based on the same ten-year average data.
- All 16 years since 2001 rank among the 17 warmest since measurements began. The last three years (2014–2016) were the warmest ever.
- As reported in the latest Assessment Report of the Intergovernmental Panel on Climate Change (IPCC), the scientific community expects an increase in the number of weather-related natural disasters as a result of climate change in the coming years.
By offering licensable data products that can be used by (re)insurance companies to help tackle climate change challenges, insurers can map better their exposed risk, provide actionable insights to their portfolio to reduce exposed risk, manage claims and identify new opportunities that can close the uninsured vs insured assets gap.
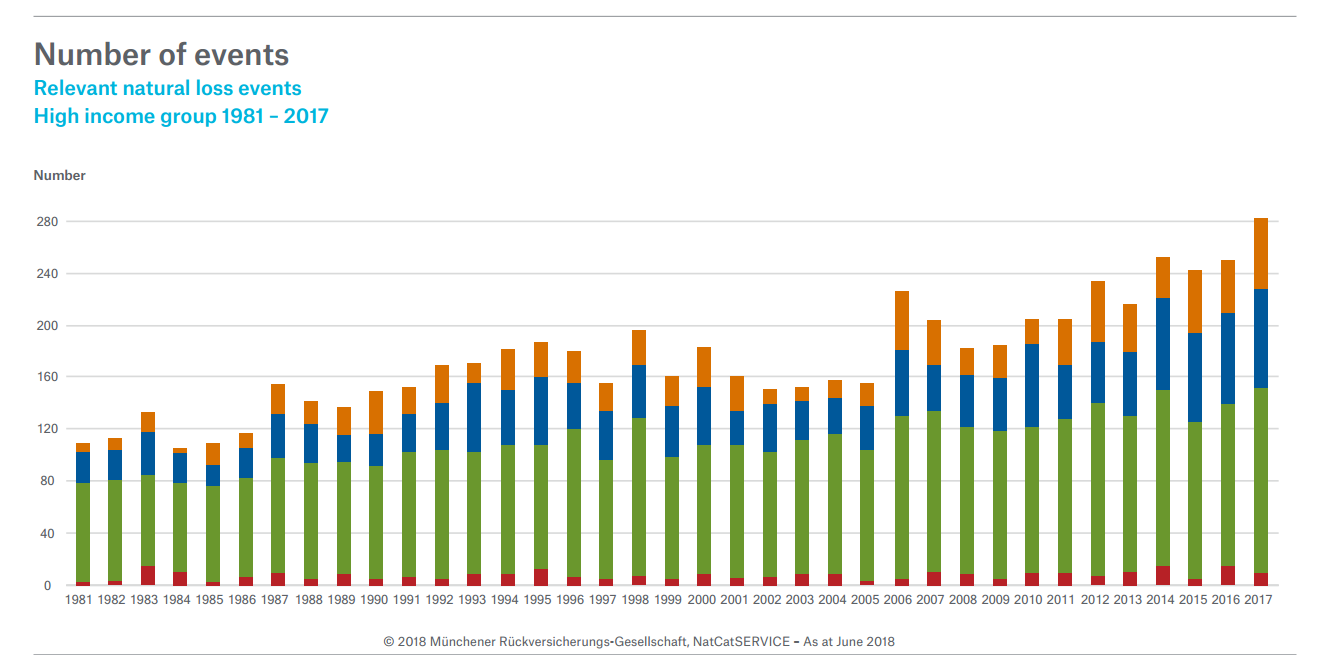
Figure 1 Number of relevant natural loss events worldwide 1980 – 2017 in high income countries Source: Munich Re
Presently West Europe, North Europe and Southwest Europe.
Service/ system concept
The user can opt for three service levels that define the level of information granularity the user gets:
- Geospatial data aggregation and zonal statistics (service level 1).
- Spatial prediction: object detection, classification and/or semantic segmentation across the spatial domain (service level 2).
- Spatio-temporal prediction: spatio-temporal forecasting across the spatial and time-domains (service level 3).
Some examples are provided here below:
Example 1: Wildfire risk management
Service level 1: Mapping of wildfire risk based on historical wildfire data and geophysical data.
Service level 2: Wildfire detection and monitoring and/or post-disaster mapping.
Service level 3: Wildfire risk forecasts based on multi-year historical data and near-real time data.
Example 2: Flood risk management
Service level 1: Mapping of flood risk based on historical flood data and geophysical data.
Service level 2: Flood mapping and monitoring.
Service level 3: Flood risk forecasts based on multi-year historical data and near-real time satellite and ground sensors data.
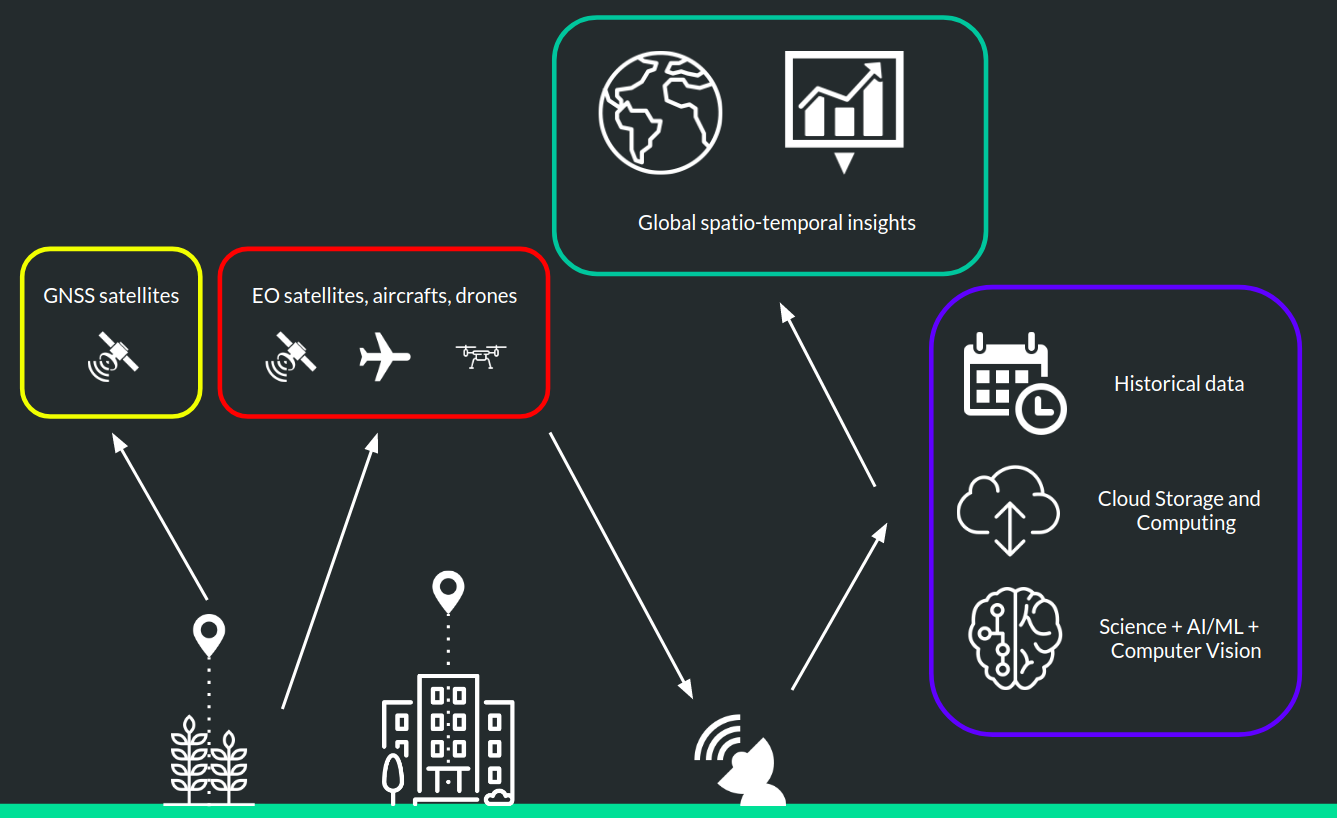
Figure 2 High-level building blocks
Space Added Value
The main space asset are Earth Observation (EO) satellites. These collect a several trillion-pixel image of Earth daily. In addition Global Navigation Satellite System (GNSS) satellites provide the information needed to georeference EO data and ground collected geospatial data.
Current Status
The activity finalised in December 2019, after performing a number of small-size proof of concepts in areas around wildfire risk and theft risk analytics, with other promising areas identified. We have gained support from several insurance sector stakeholders across the Western, Northern and Southwestern European geographies. We are considering to apply for a follow-on demonstration project to expand on these cases and some others identified